
Video on Demand in the United States
07 Jul 2015
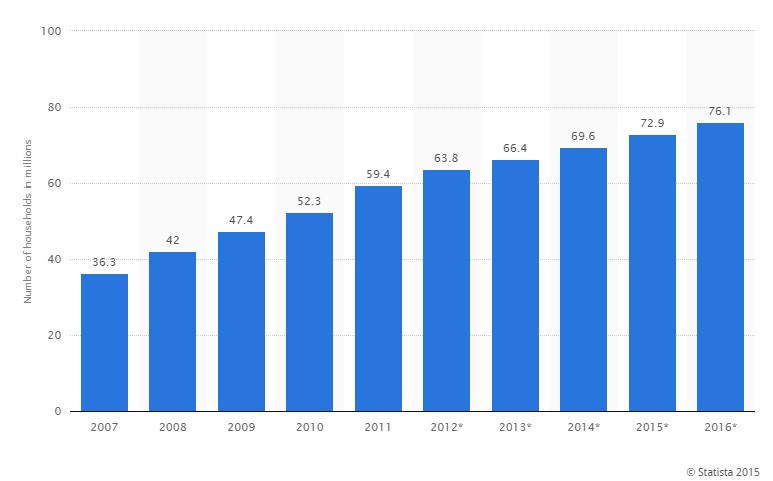
There were 52.3 million videos on demand households in the United States in 2010, according to Statista, which predicts the number will grow to 76.1 in 2016.
 According to Nielsen in The Total Audience Report Q4 2014, „over 40% of US homes had access to an SVoD service as of November 2014 and 13% of homes had multiple streaming services in their homes.” Nielsen revealed that Netflix services dominate the subscription video-on-demand services, having a 36% market share. In comparison, Amazon Prime has a 13% market share and Hulu Plus a 6.5%.
Also according to Nielsen, households with SVoD services spend 2 hours and 45 minutes on average watching content while households with traditional television spend about 1 hour and 57 minutes. SVoD users tend to be younger than traditional TV viewers (25% of SVoD subscribers are under 35 years, only 11% over 65).
The following are some key trends and findings regarding general media spending and consumer spending in the United States (North America), based on data in the Global Media Report by McKinsey & Company.
Media spending in North America
- The North American media market grew 6.8 percent in 2013. The largest gain in the past five years, according to the report, and was facilitated by strong increases in digital advertising and broadband connectivity.
-
Spending in North America rose only 1%. Outlook for regional spending
- The North American media industry is expected to grow at a pace of 5.4% compounded annually from 2013 to 2018:
- In 2008, spending in North America amounted to 395,222 ($m), increased by 2.6% between 2008 and 2013, and is expected to rise to 584,809 ($m) in 2018. Consumer spending in North America
According to the study, most consumers pay for broadband and broadband spend is expected to grow at a 9.6% compound annual rate over the next five years.
- In North America, consumer spending will grow more slowly than overall spending.
- North America will outpace Western Europe in terms of growth in consumer spending.
- In 2008, consumer spending in North America amounted to 232,346 ($m), grew at a 3.9 compound annual rate for 2008–2013, and is expected to continue to grow at 357,898 ($m) in 2018. Resources: Global Media Report 2014The Total Audience Report Q4 2014